gridMET data component
The gridMET data component, pymt_gridmet, is a Python Modeling Toolkit (pymt) library for fetching and caching daily gridMET meteorological data. Variables include:
maximum temperature
minimum temperature
precipitation accumulation
The pymt_gridmet component provides BMI-mediated access to gridMET data as a service, allowing it to be coupled with other components that expose a BMI.
Installation
pymt, and components that run within it, are distributed through Anaconda and the conda package manager. Instructions for installing Anaconda can be found on their website. In particular, pymt components are available through the conda-forge organization.
Install the pymt and pymt_gridmet packages in a new environment with:
$ conda create -n pymt -c conda-forge python=3 pymt pymt_gridmet
$ conda activate pymt
conda automatically resolves and installs any required dependencies.
Use
The pymt_gridmet data component is designed to access daily gridMET data, with the user providing the start and end dates of the desired data record. The dates can be provided through a configuration file or specified through parameters.
With a configuration file
The pymt_gridmet configuration file is a YAML file
containing two keys, _start_date and _end_date.
An example is gridmet.yaml:
_start_date: 2020-01-01
_end_date: 2020-01-07
Download this file
for use in the following example.
Start by importing the GridMet class from pymt.
from pymt.models import GridMet
Create an instance of the GridMet class and initialize it with our configuration file.
m = GridMet()
m.initialize("gridmet.yaml")
Note that the start and end dates have been read from the configuration file into the component as parameters.
for param in m.parameters:
    print(param)
('start_date', '2020-01-01')
('end_date', '2020-01-07')
What variables can be accessed from this data component?
for var in m.output_var_names:
    print(var)
daily_maximum_temperature
daily_minimum_temperature
precipitation_amount
Get the maximum temperature values for the first day.
Tmax = m.var["daily_maximum_temperature"]
Tmax_values = Tmax.data
What is the maximum maximum temperature? (Note that the data include NaN
values, which we can filter with numpy.nanmax.)
import numpy

numpy.nanmax(Tmax_values)
305.70001
But what are the units of this temperature value?
Tmax.units
'K'
Finish by finalizing the component. This cleans up resources, including deleting downloaded data files.
m.finalize()
With parameters
The start and end dates can also be passed directly to pymt_gridmet as parameters.
Start by importing the GridMet class from pymt and creating an instance.
from pymt.models import GridMet
m = GridMet()
Next, use the setup method to assign values to the start_date and
end_date parameters.
(Note that the parameter names aren’t prefixed with an underscore
like in the configuration file.)
args = m.setup(start_date="2021-01-01", end_date="2021-01-03")
Pass the results from setup into the initialize method.
m.initialize(*args)
Note that the parameters have been correctly assigned in the component.
for param in m.parameters:
    print(param)
('start_date', '2021-01-01')
('end_date', '2021-01-03')
As in the previous example, get the maximum temperature values for the first day.
Tmax = m.var["daily_maximum_temperature"]
Tmax_values = Tmax.data
To make this example a little more interesting, let’s visualize the maximum temperature data.
The pymt_gridmet component contains not only data values, but also the grid on which they’re defined. Start by getting the identifier for this grid.
gid = m.var_grid("daily_maximum_temperature")
Using the grid identifier, we can get the grid dimensions, origin, and node spacing.
shape = m.grid_shape(gid)
origin = m.grid_origin(gid)
spacing = m.grid_spacing(gid)

print("shape:", shape)
print("origin:", origin)
print("spacing:", spacing)
shape: [ 585 1386]
origin: [  25.06666667 -124.76666663]
spacing: [ 0.04166667  0.04166667]
From these values, we can construct latitude and longitude vectors.
import numpy as np

lat = np.arange(shape[0])*spacing[0] + origin[0]
lon = np.arange(shape[1])*spacing[1] + origin[1]
We’re almost ready to make a plot. Note, however, that the default
behavior of pymt components is to flatten data arrays.
Tmax_values.shape
(810810,)
Make a new variable that restores the dimensionality of the data.
Tmax_values_2D = Tmax_values.reshape(shape)
Tmax_values_2D.shape
(585, 1386)
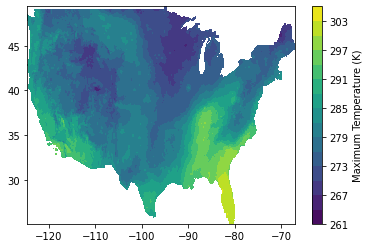
Make a simple filled contour plot of the data with a colorbar.
import matplotlib.pyplot as plt

plt.contourf(lon, lat, Tmax_values_2D, 15)
plt.colorbar(label="Maximum Temperature (K)")
Complete the example by finalizing the component.
m.finalize()